
CAPMAC / CARI-Chiller
CARI-Chiller · Cooling plant healthYour whole cooling plant, on one page.
CARI-Chiller reads the records your building management system already keeps and shows your team which chiller, tower, pump, air handler or data-hall unit needs attention. Chillers get alerts with an urgency grade, the extra energy and its cost, and the days left to the condenser cleaning limit. Every other plant unit gets named findings with dates.
- Chillers, towers, pumps, air handlers, data halls
- Named findings, with dates
- No BMS connection, no internet
- Read-only
Watch the film
3 min 14 s, with captions. Sound on for the narration.
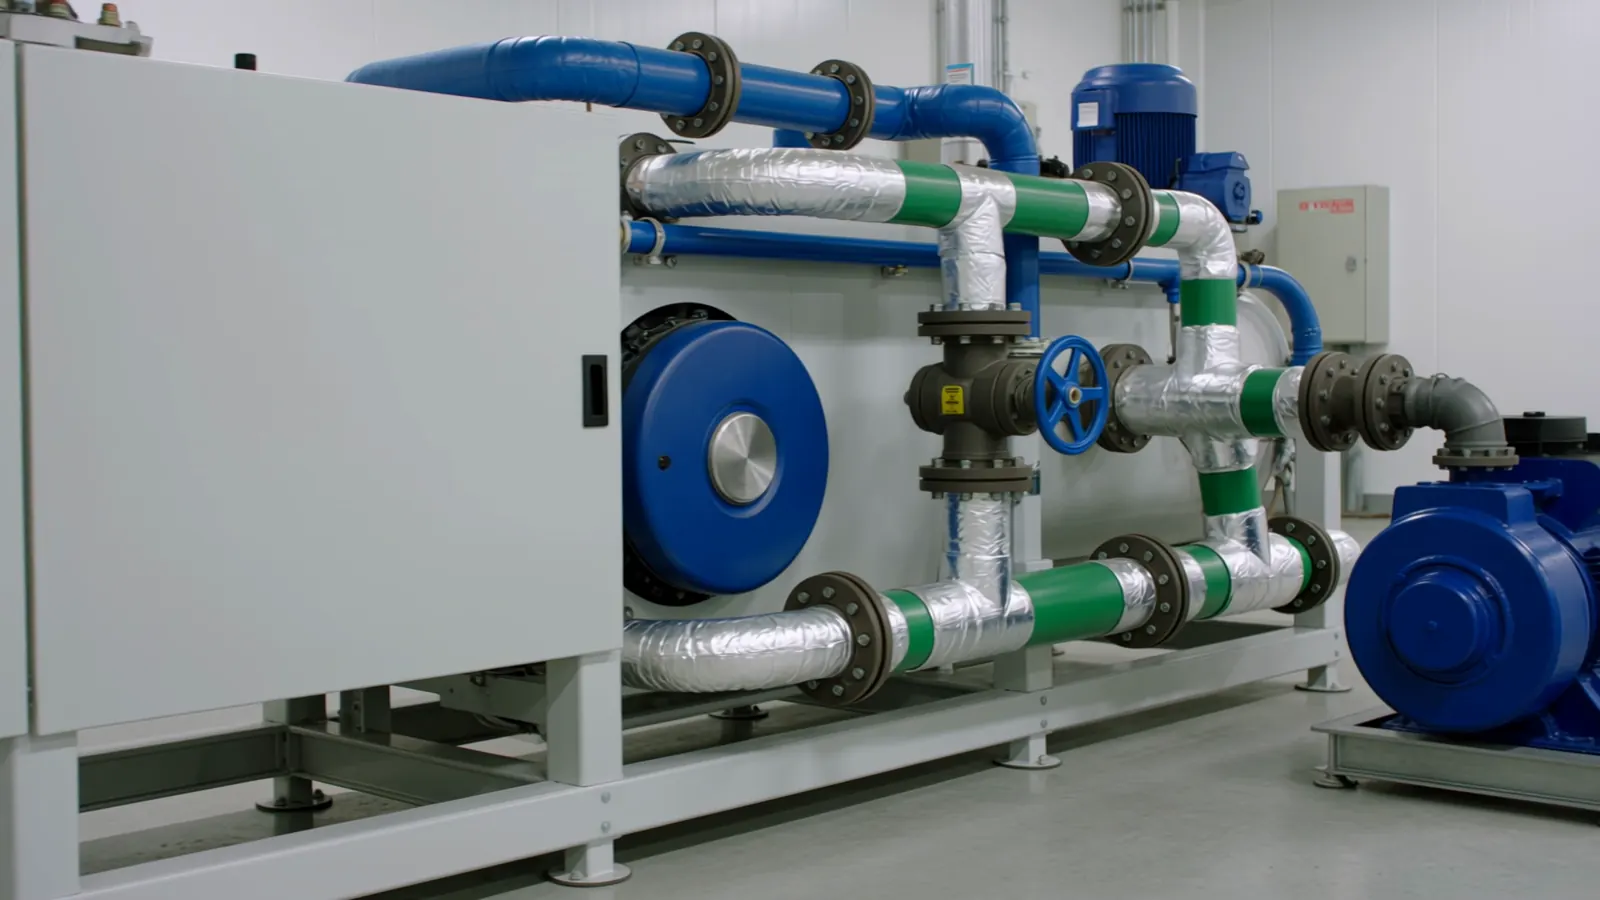
Six parts of the plant. One plant page.
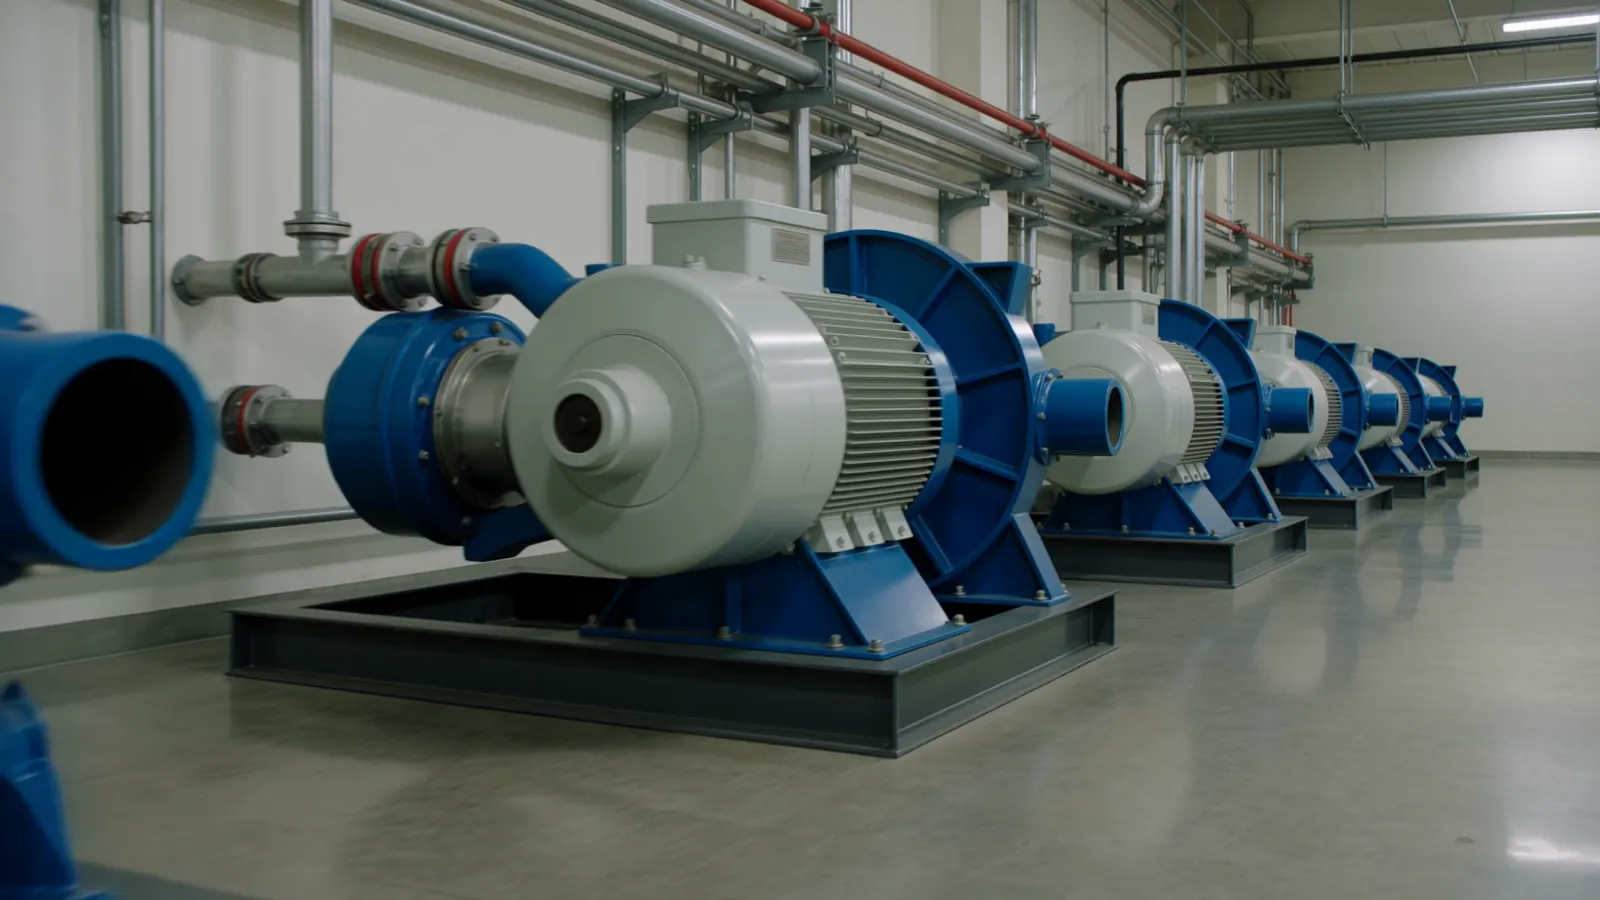
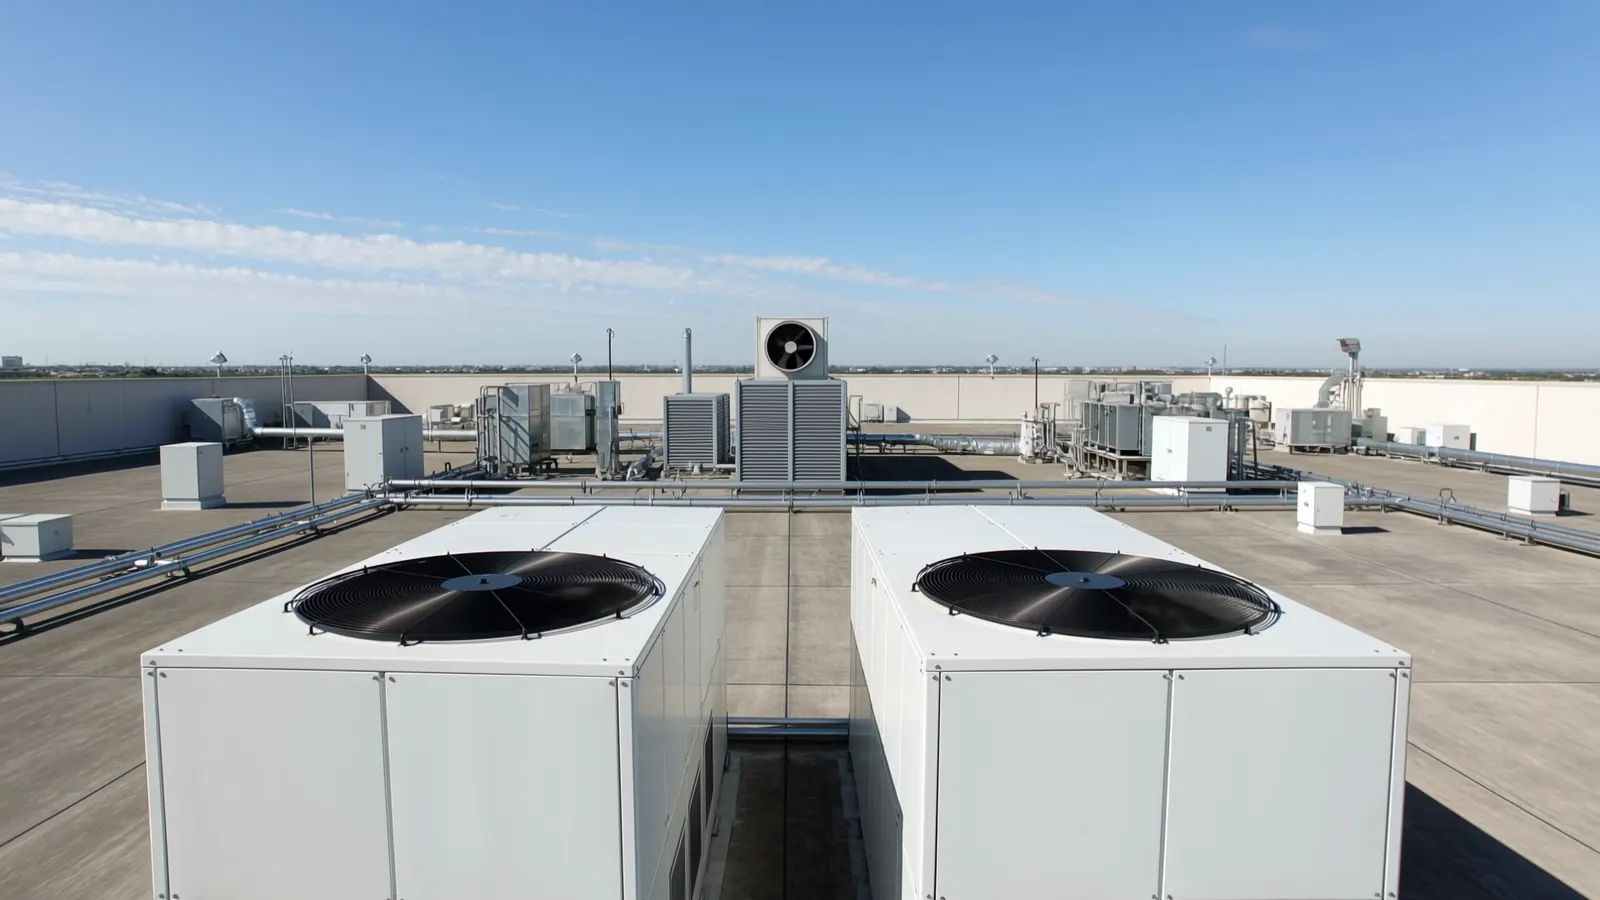
A chiller never works alone. CARI-Chiller follows the cooling from the tower on the roof to the air handler on the floor and the cooling units in the data hall, and reports on each part from the same file.
Cooling tower and condenser loop
Weak cells, fan belts, fouled condensers, water treatment, make-up and water loss.
Chillers
Drift against each chiller's own normal, days to the cleaning limit, extra energy and its cost.
Pumps and water loops
Deficit flow in the bypass, a weak primary side, worn or inefficient pumps.
Air handlers and fans
Heating fighting cooling, low duct pressure at full fan speed, sensors that read wrong.
Data-hall units
The unit out of step with the others, valve hunting, and hot rack rows.
Free cooling
An economiser valve in the wrong place for the weather, and an exchanger losing effectiveness.
A real change stands out from a hot day.
Your engineer picks the weeks the team calls normal. From then on every water-cooled chiller in the file is compared with its own normal running, at the same load and weather.
Alerts say which readings moved, by how much, from when, and whether the change still shows. Each open alert carries an urgency grade, Keep watching or Fix at next stop, so the team knows what to plan.
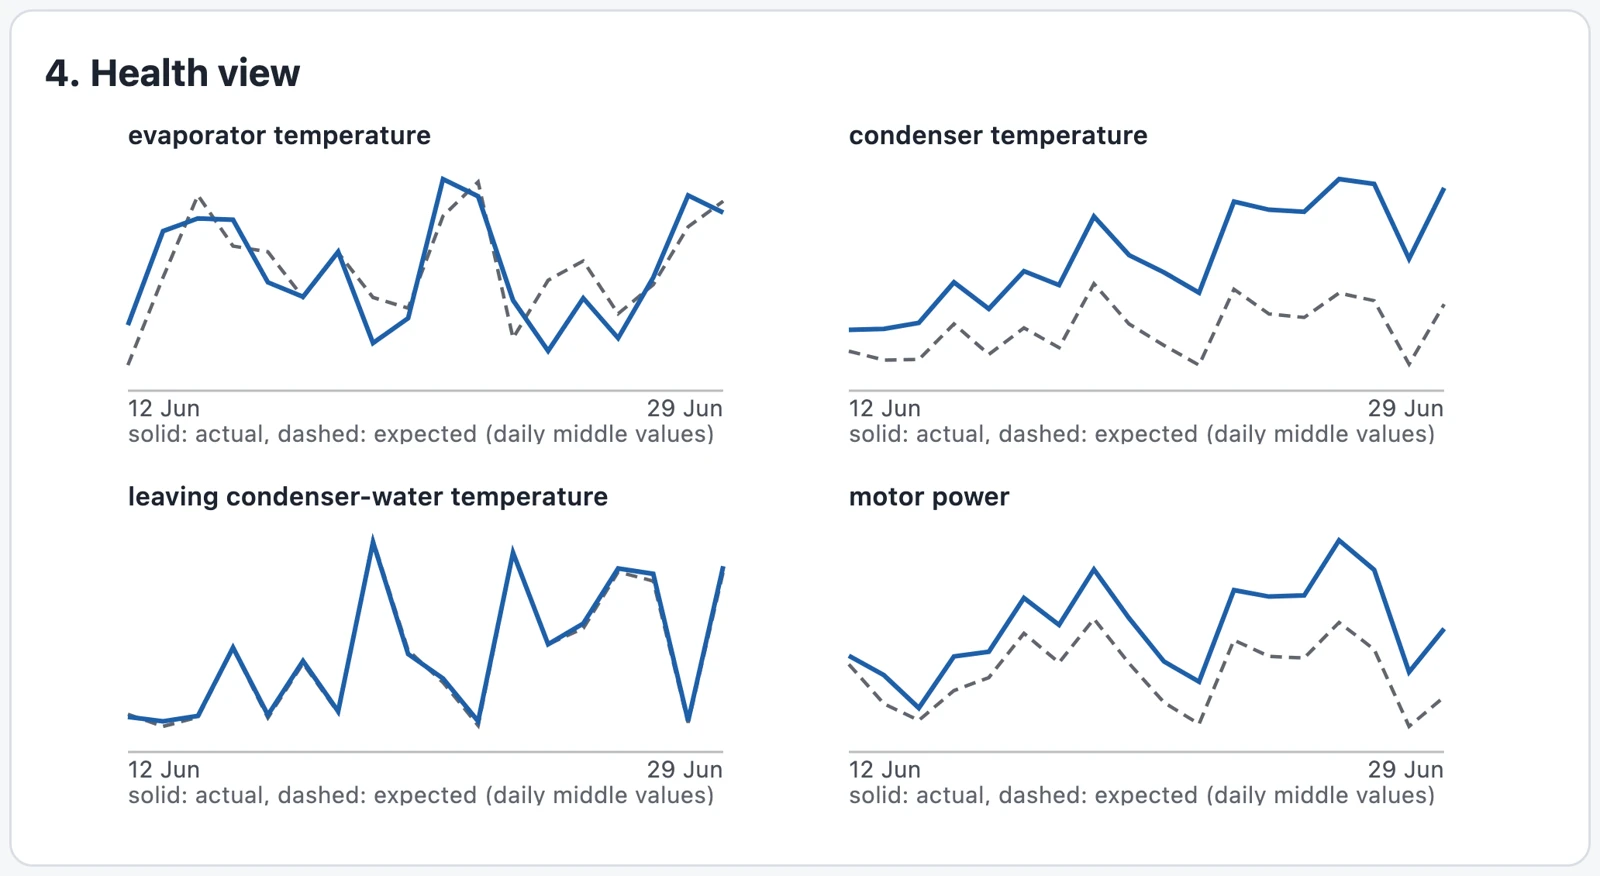
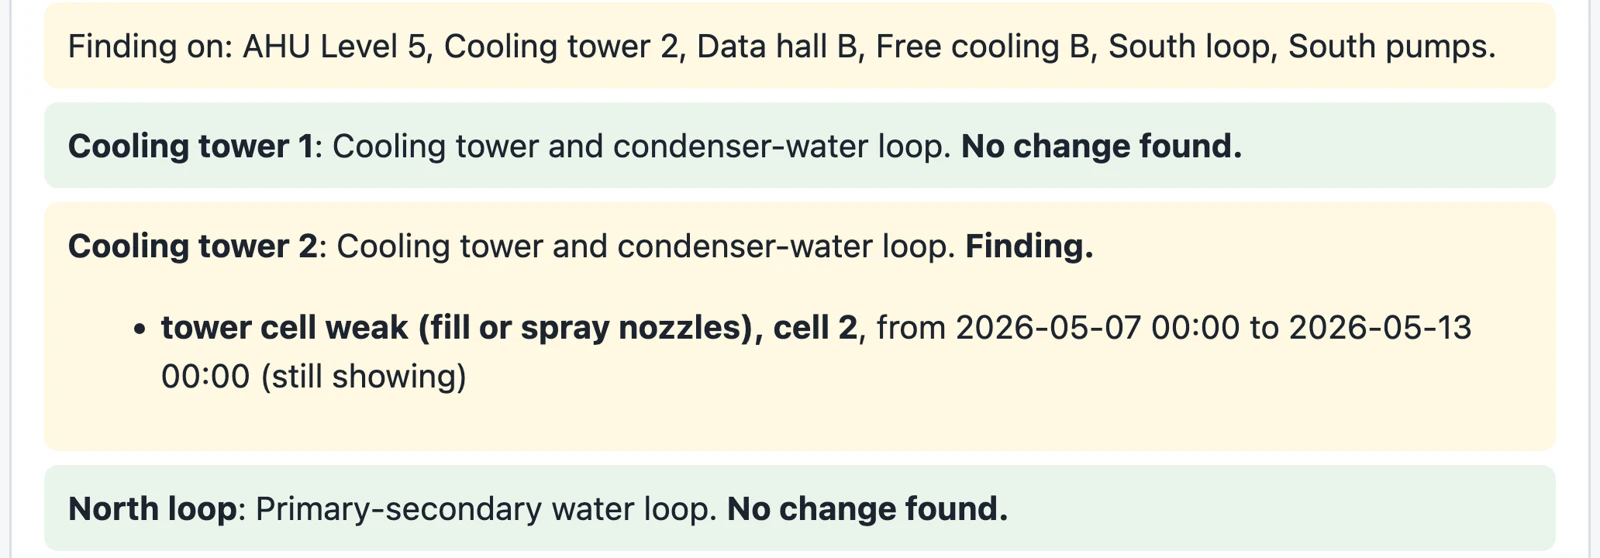
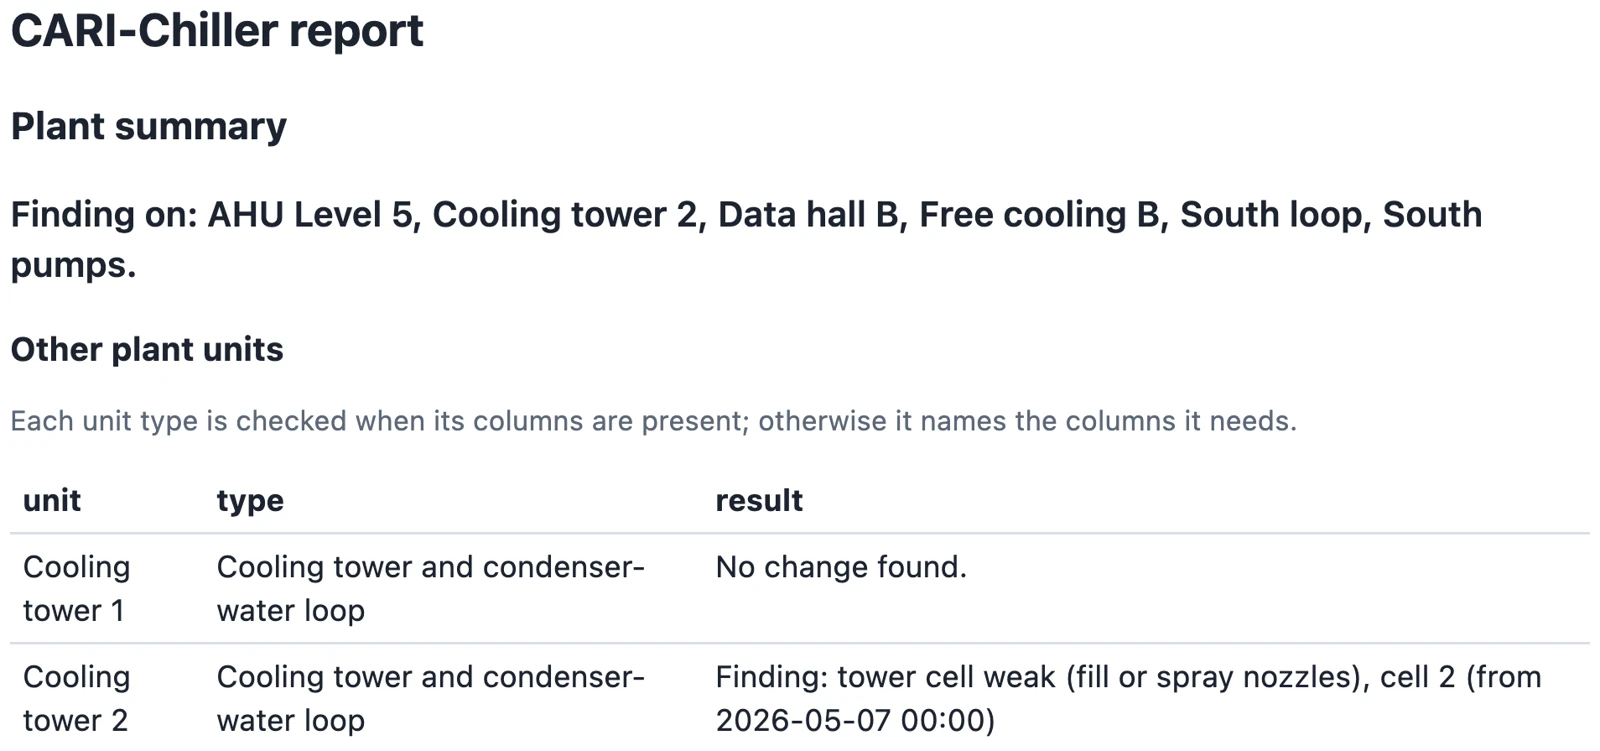
The unit, the finding, and the dates.
Each tower, loop, pump group, air handler, data-hall group or economiser carries its own line: no change found, or a named finding with the dates it was seen. In this example from our own test plant, one cell of a cooling tower has weakened, and the plant page names it.
Tested on our own test plants built to industry practice.
One export. Your PC. Nothing leaves it.
CARI-Chiller works beside the systems you already run. It needs no connection to the building management system and no change to the controls: you load a file, on your own computer.
Export
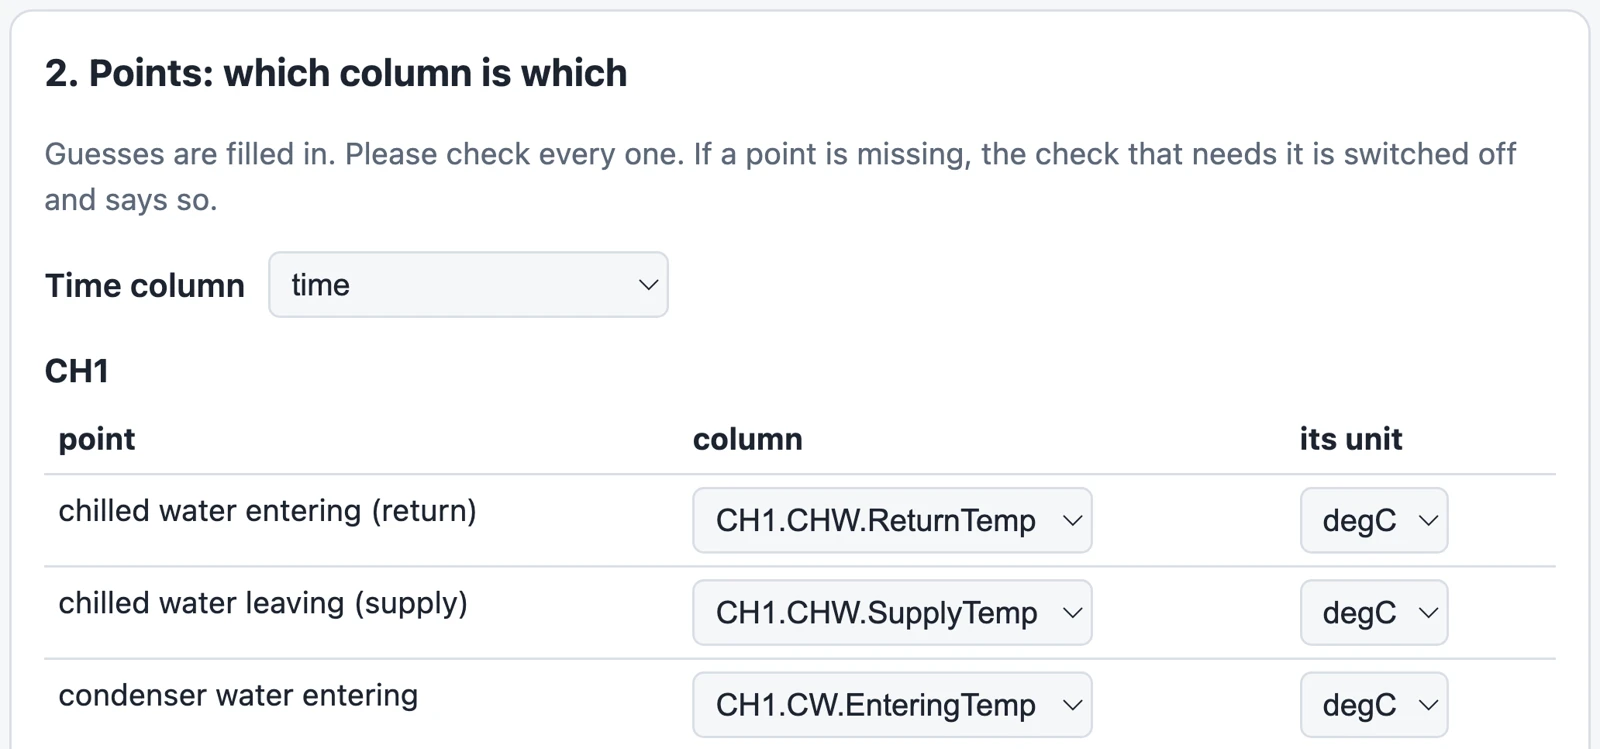
From your BMS or historian as CSV. One row per time step, one column per point.
Confirm the points
The app proposes which column is which. Your engineer confirms each one and adds the plant units.
Pick the normal weeks
The dates your team calls normal; price and cleaning limit if used.
Read the plant page
Status, alerts, findings, cleaning time, energy and the report.
Wherever cooling carries the building.
The same application serves a single tower block and a campus-wide plant. A unit is checked whenever its points are in your export, so the plant page grows with your plant.
Commercial buildings
Your building management system already keeps the trends. CARI-Chiller turns its export into a plant page the facility head reads in minutes.
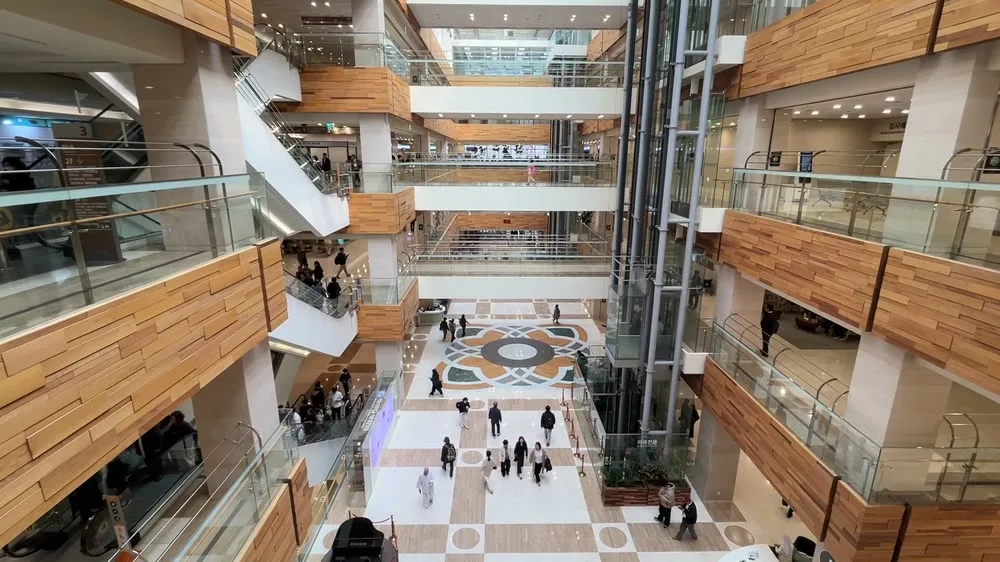
Malls and retail
Long opening hours and large air handlers. See heating fighting cooling in an air handler, and the chiller that drifts through the season.

Data centres
Know which hall unit is out of step, which rack row runs hot, and the dated findings on free cooling.

Hospitals
A plant that cannot stop. Plan condenser cleaning ahead of the limit, with a record of who acted on every alert.
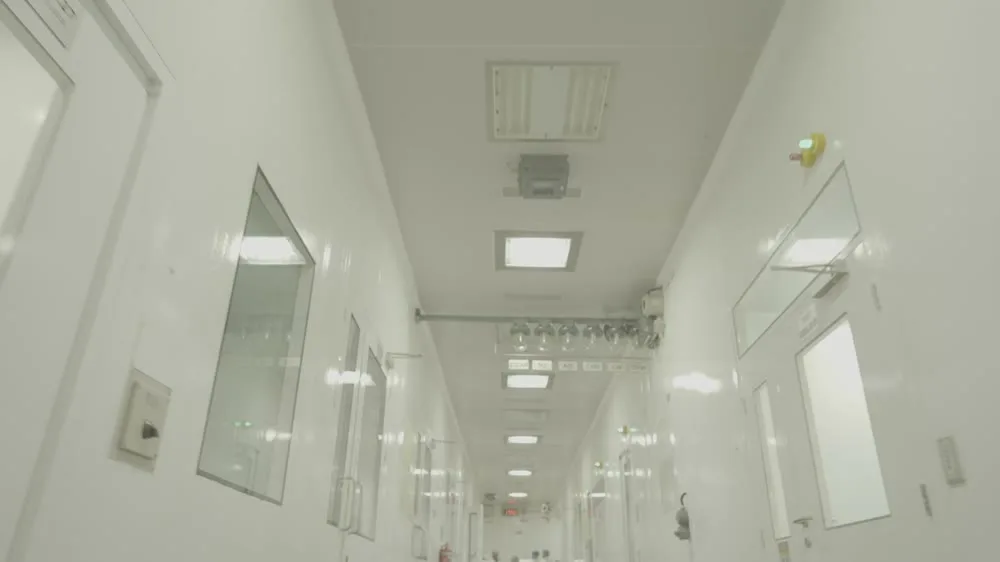
Pharma and process cooling
Chilled water the process depends on. See a weak pump or deficit flow in the loop named, with the dates.
And more
Hotels, airports, IT parks and district cooling: several buildings or many chillers, each judged on its own, with a saved project for each site.
Answers a plant head can plan with.
Days to the cleaning limit
Condenser approach is followed day by day against your chiller maker's cleaning limit. You get a band of days, redrawn with every new file, so cleaning is booked ahead.
Extra energy and its cost
The power a chiller draws above its normal while an alert is open is added up and priced with your own electricity price, in any currency. Open alerts are ranked by cost.
From alert to work order
Acknowledge, close and reopen chiller alerts with names and reasons. A second person closes each one. One row per alert for maintenance planning.
One printable report
A one-page plant summary for the plant head, then a sheet for each chiller and each plant unit.
On your own PC. With your own team.
Where it runs
On your own PC, opened in a web browser. It needs no internet. It only reads exported files: it writes nothing to a chiller or its controls and sends no data elsewhere.
Your system, your points
Works from a CSV export of your building management system or historian. Units, dates and points are read from your file and confirmed by your engineer.
Set up with you
CARIMO sets up the app with your team, confirms the points together and walks through the first plant page, the alerts and the report.
CARI-Chiller watches the cooling plant. CARI-Loops finds the control loops and valves that need you, and CARI-Tune is CARI-Loops plus tuning.
Take it to your team.
Short summary
Two pages: the whole cooling plant on one page, and what goes in and comes out. PDF · 2 pages · 648 KB
OpenBrochure
Twelve pages: the six plant parts, chiller alerts, work orders, the report and where it works. PDF · 12 pages · 2.7 MB
OpenTechnical annexe
Part by part, for your engineers: the export, each plant unit and what it reads. PDF · 10 pages · 1.9 MB
OpenStart with one plant. See your plant page.
Choose one cooling plant and export a few months of its records. We set CARI-Chiller up on your PC with your team and walk through the first plant page.